Mapping Seasonal Trends in Game Popularity to Schedule Broadcasts for Optimal Reach
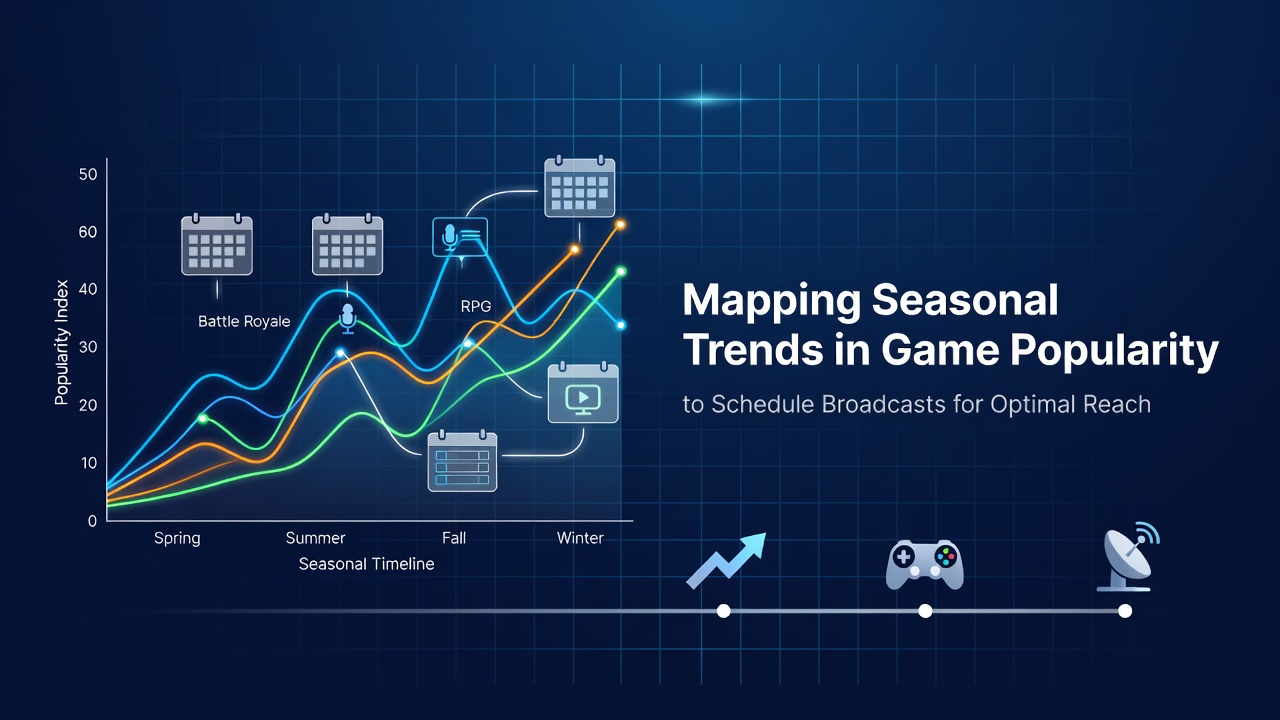
Broadcast schedulers track game popularity patterns that shift with seasons, holidays, and school calendars because these cycles directly influence viewer availability and engagement levels. Data from multiple years reveals consistent spikes during back-to-school periods for multiplayer titles, summer lulls in certain genres, and major increases around holiday releases when new content drops.
Understanding Seasonal Patterns in Gaming Audiences
Researchers compile historical viewership metrics alongside release calendars to identify recurring trends, and this mapping process starts with collecting data on concurrent players, search volumes, and social mentions across platforms. Observers note that sports simulations peak in late summer and early fall when real leagues begin, whereas battle royales maintain steadier interest but see surges during competitive events timed with school breaks.
Those who study audience behavior point out that December often brings family-oriented play sessions while January shows renewed focus on competitive ladders after holiday downtime. Mapping these shifts allows schedulers to align live sessions with periods when target demographics log in most frequently, which improves reach without requiring additional promotion spend.
Data Sources and Mapping Techniques
Industry reports from organizations like the Entertainment Software Association provide baseline statistics on quarterly sales and player counts, while academic studies from institutions such as the University of Alberta track longitudinal engagement across regions. Schedulers combine these with platform analytics to create heat maps that highlight optimal broadcast windows for specific genres.
One approach involves overlaying public release schedules with private telemetry to forecast demand curves, and this method helps identify gaps where lesser-known titles can capture attention before major launches dominate feeds. Figures from Canadian gaming associations show that titles released in March often maintain momentum through spring because fewer competing products enter the market during that window.
Practical Scheduling Applications
Broadcasters who apply seasonal mapping adjust start times to coincide with after-school hours in fall or evening family windows during winter, and they cross-reference these times against competitor programming to avoid direct overlap. For instance, a July 2026 analysis of prior summer data indicated that outdoor activity games gained traction during evening slots when viewers sought indoor alternatives to warm weather.
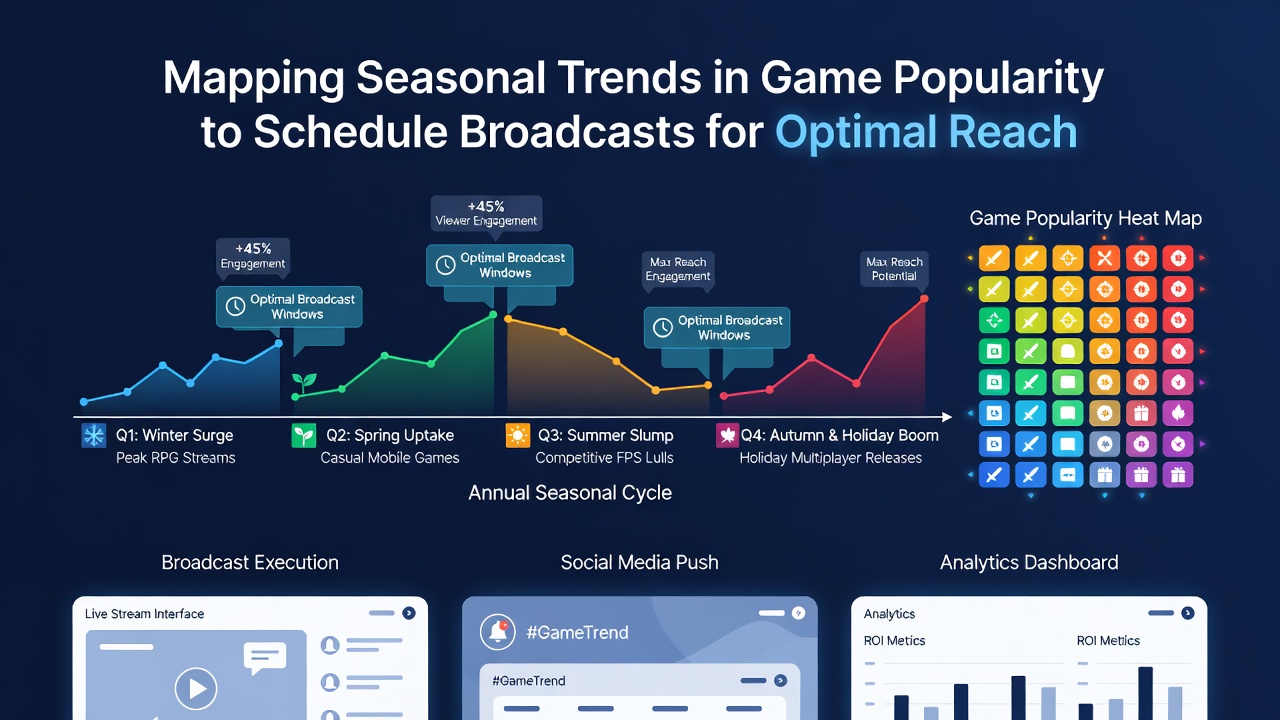
Teams integrate tools that pull real-time metrics and historical comparisons, which allows quick adjustments when unexpected events like major patches alter normal patterns. The Interactive Games and Entertainment Association in Australia publishes regional breakdowns that schedulers use to tailor content for Southern Hemisphere audiences where seasons invert typical Northern patterns.
Case Examples from Observed Broadcasts
One documented case involved a studio that shifted its monthly esports qualifiers from midweek to weekend evenings after reviewing three years of retention data showing higher participation during those blocks. Another example highlighted how horror game streams performed better in October when cultural interest aligned with seasonal themes, leading to sustained viewer counts across multiple weeks.
Observers tracking European markets note that summer tournaments scheduled around major sports off-seasons draw crossover audiences because viewers seek alternative live entertainment. These adjustments rely on continuous data feeds rather than assumptions, which keeps scheduling responsive to actual behavior shifts.
Conclusion
Mapping seasonal trends equips broadcast planners with evidence-based timing strategies that align game content with audience availability cycles. Organizations continue refining these models through combined sales figures, player telemetry, and regional reports, which supports more precise reach optimization across global markets.