Mapping Audience Retention Curves: Adjusting Segment Pacing Based on Live Metrics
Live streaming platforms generate detailed retention curves that track viewer drop-off points across entire broadcasts, and these visualizations reveal patterns tied directly to segment length, content shifts, and pacing decisions. Data from June 2026 shows continued growth in real-time analytics usage among gaming broadcasters, with platforms integrating live dashboards that update every few minutes to reflect concurrent viewer counts, chat velocity, and average watch duration. Observers note that retention curves typically exhibit sharp declines at predictable intervals, often coinciding with extended exposition segments or repetitive gameplay loops, which allows creators to correlate these drops with specific pacing choices.
Understanding Retention Curve Components
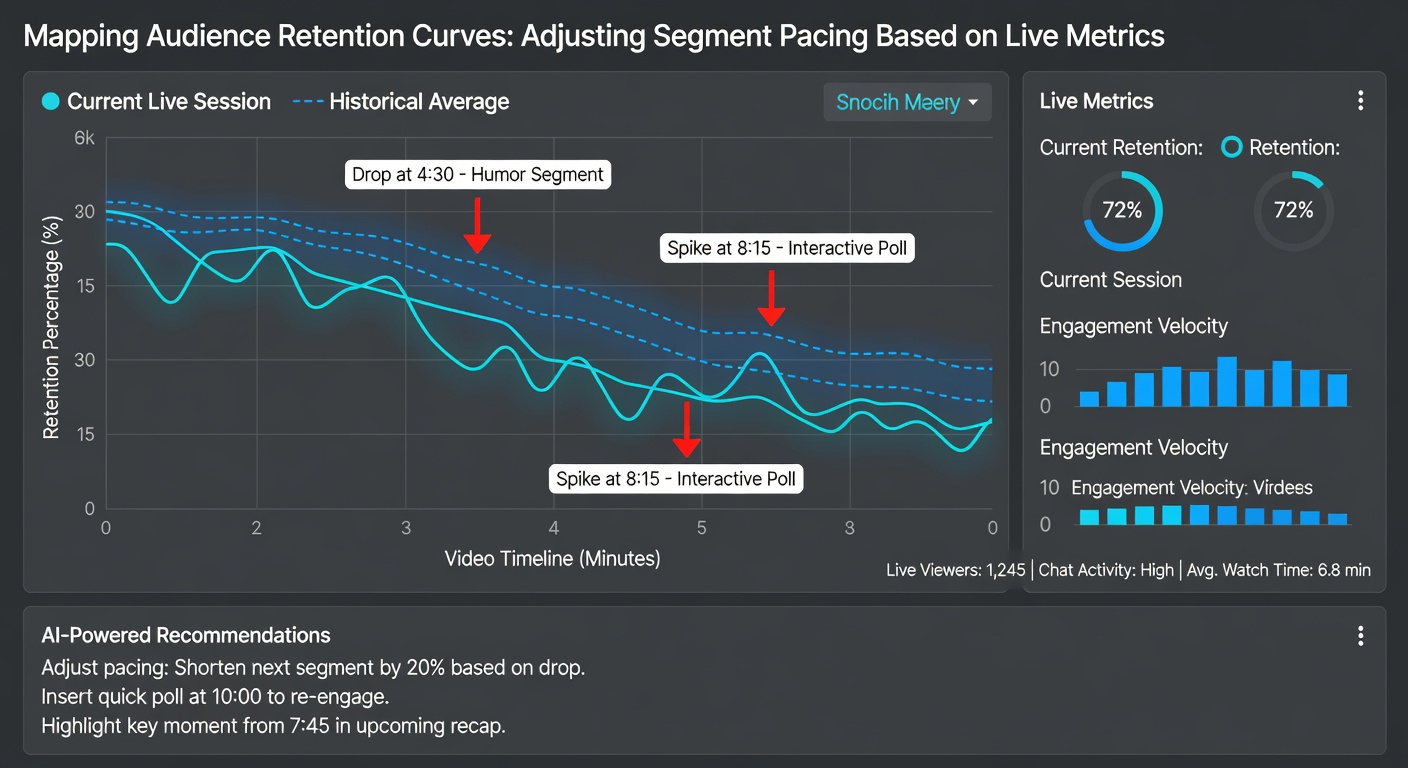
Retention curves plot the percentage of initial viewers remaining at each timestamp, and analysts break these into phases that include an opening hook period, a mid-broadcast plateau, and a closing tail. Live metrics feed into these curves through platform APIs that capture second-by-second engagement signals, including subscription spikes during high-tension moments and raid influxes that temporarily flatten decline slopes. Researchers from multiple institutions have documented how early curve steepness predicts overall completion rates, with figures from industry reports indicating that broadcasts maintaining above 60 percent retention past the 30-minute mark achieve higher total watch hours on average.
Live Metric Integration Techniques
Real-time dashboards pull data on viewer count fluctuations alongside sentiment analysis from chat logs, and these inputs enable broadcasters to identify when pacing adjustments become necessary mid-stream. For instance, a sudden dip in concurrent viewers paired with reduced message frequency often signals audience fatigue with current segment length, prompting shorter transitions or varied gameplay focus. Platforms supply timestamped overlays that align metric shifts with curve points, which helps teams map cause-and-effect relationships without relying on post-broadcast review alone.
Those analyzing multiple streams have observed that segments exceeding eight minutes without structural change frequently correspond to accelerated drop-offs, while shorter modules interspersed with interactive prompts sustain flatter curves longer. Adjustments occur through deliberate pacing recalibration, such as accelerating narrative delivery during lulls or inserting brief cutaways that reset attention cycles based on incoming live data feeds.
Segment Pacing Adjustments in Practice
Broadcasters monitor retention curves alongside live viewer graphs to decide when to compress upcoming segments or extend high-engagement sections, and this process relies on threshold triggers like a five percent minute-over-minute decline in average view duration. Case examples from competitive gaming events demonstrate how teams shortened boss encounter breakdowns after observing early exits clustered around the seven-minute mark, resulting in redistributed pacing that recovered several percentage points in retention by the broadcast midpoint. Live metrics also track external factors such as overlapping events on other channels, which can accelerate curve drops independently of internal pacing and require compensatory content shifts.
According to a Pew Research Center analysis of digital media habits, viewers in the 18-34 demographic respond more readily to pacing changes signaled through on-screen timers or chat callouts that acknowledge live metric shifts. This responsiveness allows for dynamic segment recalibration without breaking immersion, as broadcasters reference current retention trends directly in commentary. Data indicates that such transparent adjustments correlate with reduced churn in later broadcast phases compared to static pacing approaches.
Tools and Data Sources for Curve Mapping
Analytics suites within major platforms provide exportable retention datasets that integrate with third-party visualization software, enabling detailed segmentation by hour or by specific game title. Government-linked media research from the Canadian Radio-television and Telecommunications Commission supplies broader context on national streaming consumption patterns, which complements platform-specific curves by highlighting regional differences in average session lengths. Broadcasters combine these external benchmarks with internal live metrics to refine pacing baselines, adjusting segment durations according to whether observed retention exceeds or falls below comparable historical averages.
Additional sources include academic studies on viewer attention spans that quantify how pacing variations affect sustained engagement across different content categories. These studies supply reference points for interpreting live curve data, particularly when broadcasters encounter unexpected metric divergences during high-stakes tournament coverage. Integration of such references supports consistent pacing decisions even as audience composition shifts throughout a single extended stream.
Conclusion
Mapping audience retention curves through live metrics creates a feedback loop that informs segment pacing decisions in real time, and continued platform developments through mid-2026 have expanded the granularity of available signals. Broadcasters who align adjustments with observed drop-off patterns maintain steadier viewer retention across full transmissions, supported by combined insights from industry reports and platform analytics. This approach relies on continuous correlation between metric fluctuations and curve trajectories rather than fixed segment templates.